The CRM Dashboard has widget moving capabilities for a customized dashboard layout. To the top right of each section/widget, you can click/hold on the square icon to drag it to another location for a customized layout.
The Dashboard is the default page you will see after logging in.
The filters at the top can be used to filter between campaigns, affiliates, and specific date ranges.
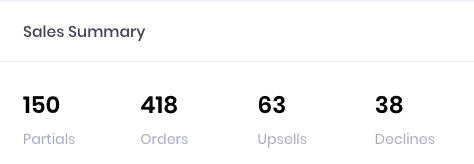
Sales Summary - Displays the number of partials, orders, upsells, and declines
Partials - the amount of inquiries or leads
Orders - total amount of initial orders or signups
Upsells - total amount of upsells
Declines - the total amount of declines
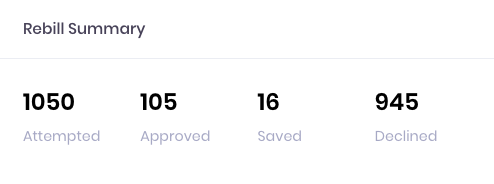
Rebill Summary - displays the number of recurring charges that have been attempted, approved, saved, and declined
Attempted - the amount of recurring charges that were attempted to process
Approved - the amount of recurring charges that were successfully processed
Saved - the amount of recurring charges that were successfully processed after retry attempts
Declined - the amount of recurring charges that were declined
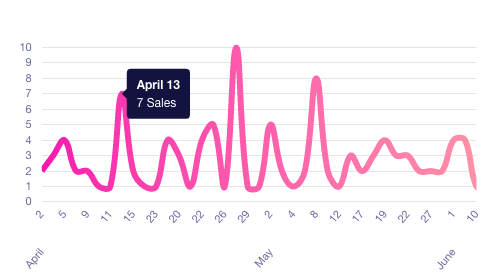
Conversion/Sales
This graph displays the daily breakdown of total sales or conversions. Hovering the mouse over each point will display the number of sales for that day
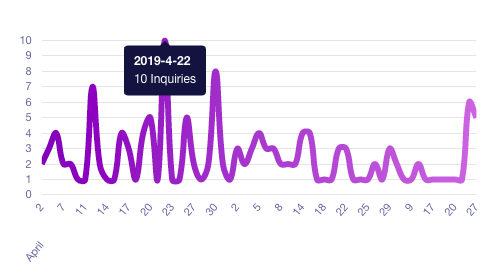
Inquiries/Partials
This graph displays the daily breakdown of inquiries. Hovering the mouse over each point will display the number of inquiries for that day
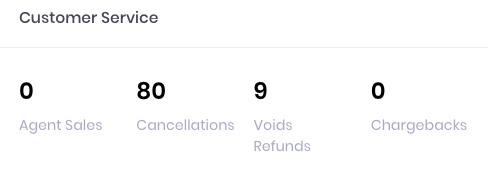
Customer Service - displays the number of call center driven agent sales, as well as overall cancellations, refunds/voids, and chargebacks
Agent Sales - the amount of sales that have occurred through customer service calls
Cancellations - the amount of cancellations
Voids/Refunds - the amount of voids or refunds
Chargebacks - the amount of chargebacks
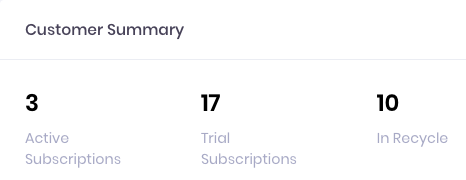
Customer Summary - displays the number of call center driven agent sales, as well as overall cancellations, refunds/voids, and chargebacks
Active Subscriptions - the amount of subscriptions that have already processed their first cycle
Trial Subscriptions - the amount of subscriptions that haven't processed their first cycle yet
In Recycle - the amount of subscriptions that have processed after retry attempts
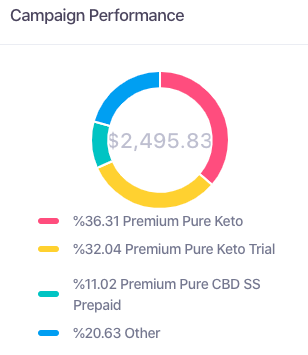
Campaign, Product, and Affiliate performance
Campaign Performance - The monetary performance of your campaign/Site ID
Product Performance - The sales performance of individual products
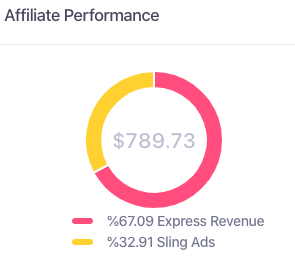
Affiliate Performance - The monetary performance of your affiliates
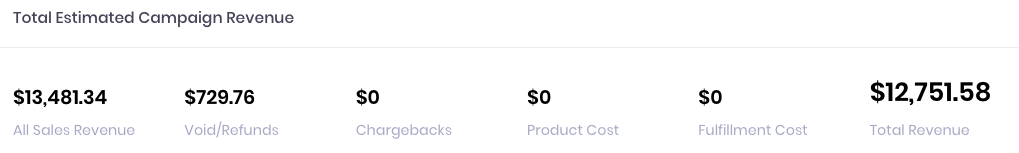
Total Estimated Campaign Revenue
All Sales Revenue - Total revenue processed
Voids/Refunds - Total monetary amount of voids and refunds processed
Chargebacks - Total monetary amount of chargebacks
Product Cost - Total product cost of all sold goods
Fulfillment Cost - Total shipping/fulfillment cost of all sold goods
Total Revenue - Total amount after subtracting all costs from All Sales Revenue
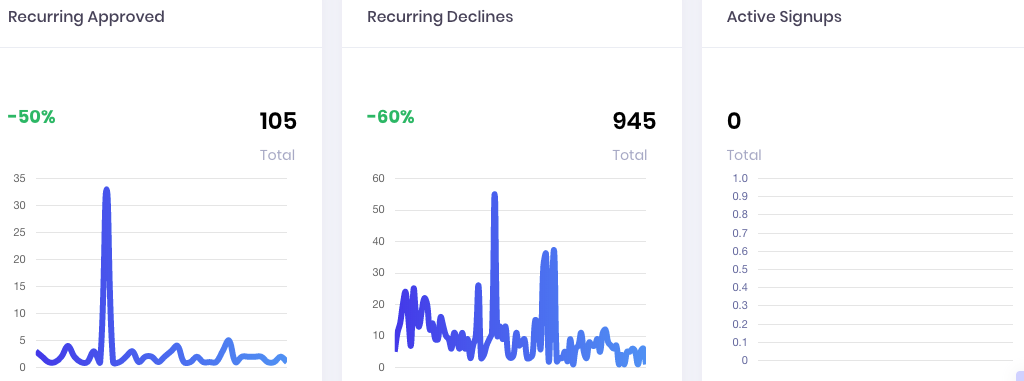
Recurring Approved, Recurring Declined, and Active Signups displayed as charts
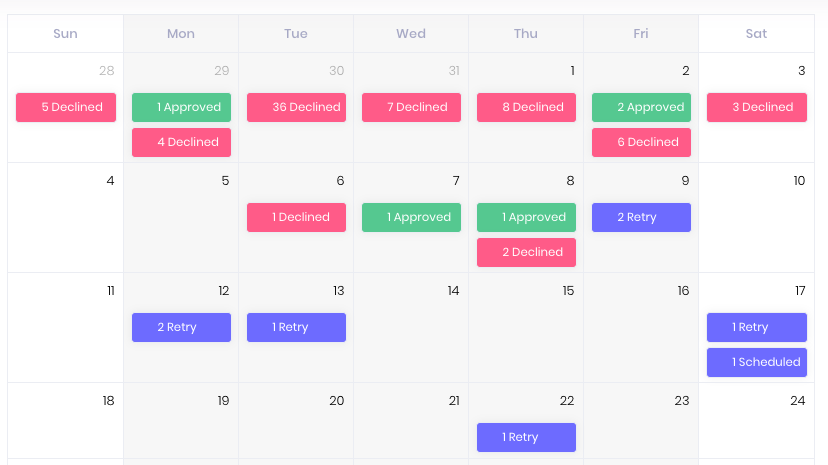
Rebill Calendar - Calendar display of your daily subscription charge activity and results
Approved - the amount of successfully subscription charges
Declined - the amount of declined subscription charges
Scheduled - the amount of subscription charges scheduled to run
Retry - the amount of subscription charges that are in recycle/retry status
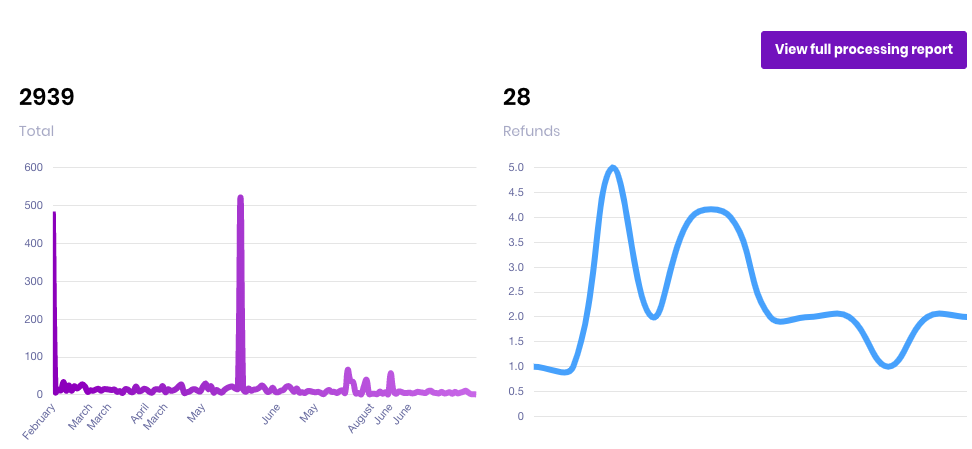
Processing Viewer - Chart view of total sales and refunds
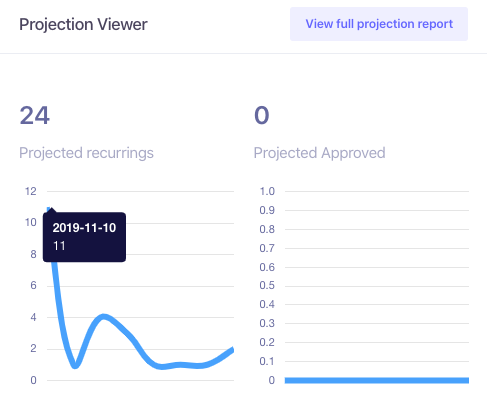
Projection Viewer - Chart view of upcoming rebill or recurring charges, with a project approved number that is based on an algorithm of your last 3 months recurring processing history.