The Income Report essentially lets you see how much net income your campaigns are yielding (includes all initial signup/upsell and recurring transactions) and what your average income per customer is.
The Income Report totals should not be compared to the Transaction History Report manually calculated totals, as it includes customers that have been created within the date range selected and all their activity within the date range. The Transaction History Report shows you customer activity that happens in the date selected regardless of when the customer was entered into the system.

In the CRM menu, go to Reports > Income
-
Select the Site(s) that you want to query
-
Select the date range then click Search.
Results
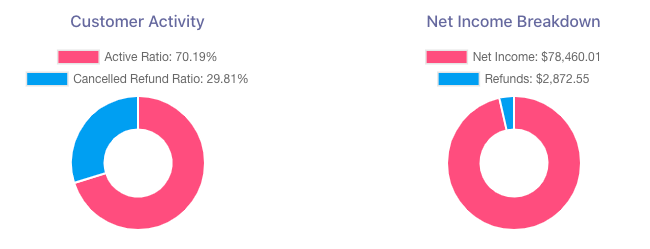
Charts & Graphs:
The Income Charts present the customer activity of your campaigns and the net income breakdown.
-
-
The Customer Activity pie chart shows your active customers (customers enrolled in subscription billing) and the canceled customers (inactive customers).
-
The Net Income Breakdown pie chart shows the net income and the amount of refunds.
-
Select which option you want to filter for your report (BIN, Amount, Processor, Affiliate, or Site) then click Search.
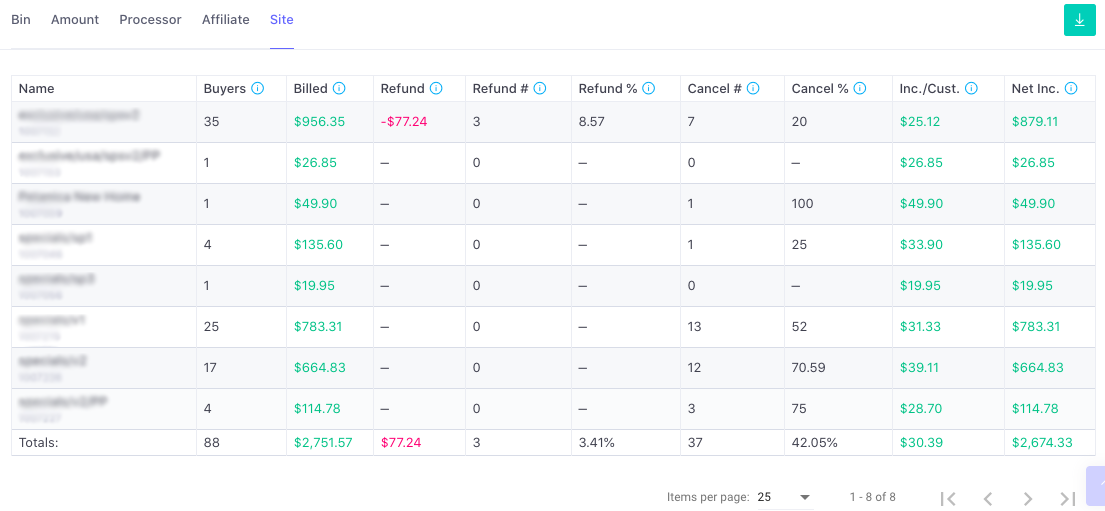
List of Terms:
Buyers: the total number of buyers
Billed: the total amount billed to the #BUYERS
Refund: the total amount for refunds issued
Refund #: the total number of refunds issued
Refund %: the ratio of refunds in relation to #BUYERS
Cancel #: the total number of cancellations
Cancel %: the ratio of cancellations in relation to #BUYERS
Inc/Cust: the average income per customer
Net Inc: the net income for your campaign(s) within your selected date range.